本文参考:
- NV 官方 Profiling Guide 给出了基于 NCU 的 profile 指南
- gdb
NCU 的使用结合官方文档学习。
NCU 使用 tip
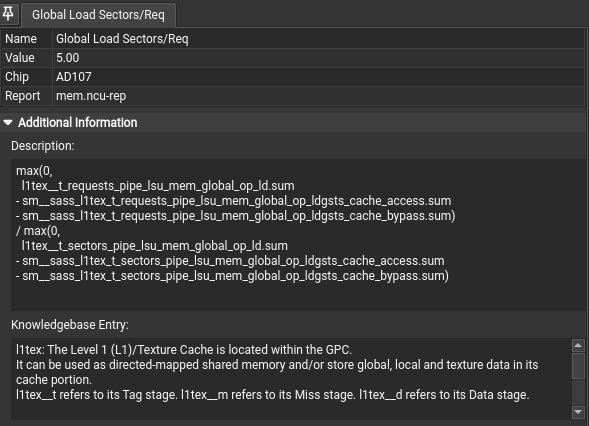
打开 Metric Details,然后点击界面里的文字或图标,可以查看它们的解释文档。
nvcc -O3 -arch=sm_xx -lineinfo xx.cu
ncu --export ./mem.ncu-rep ./a.out --set full导出文件
source
-lineinfo 即可查看源码和 ISA的对应情况。
Memory
在 Metrics下勾选full生成所有性能的报告。
https://zhuanlan.zhihu.com/p/632244210
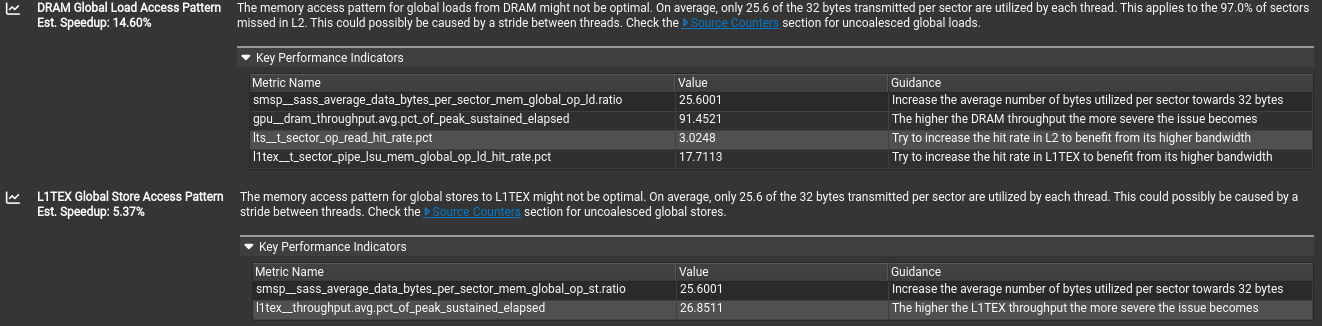
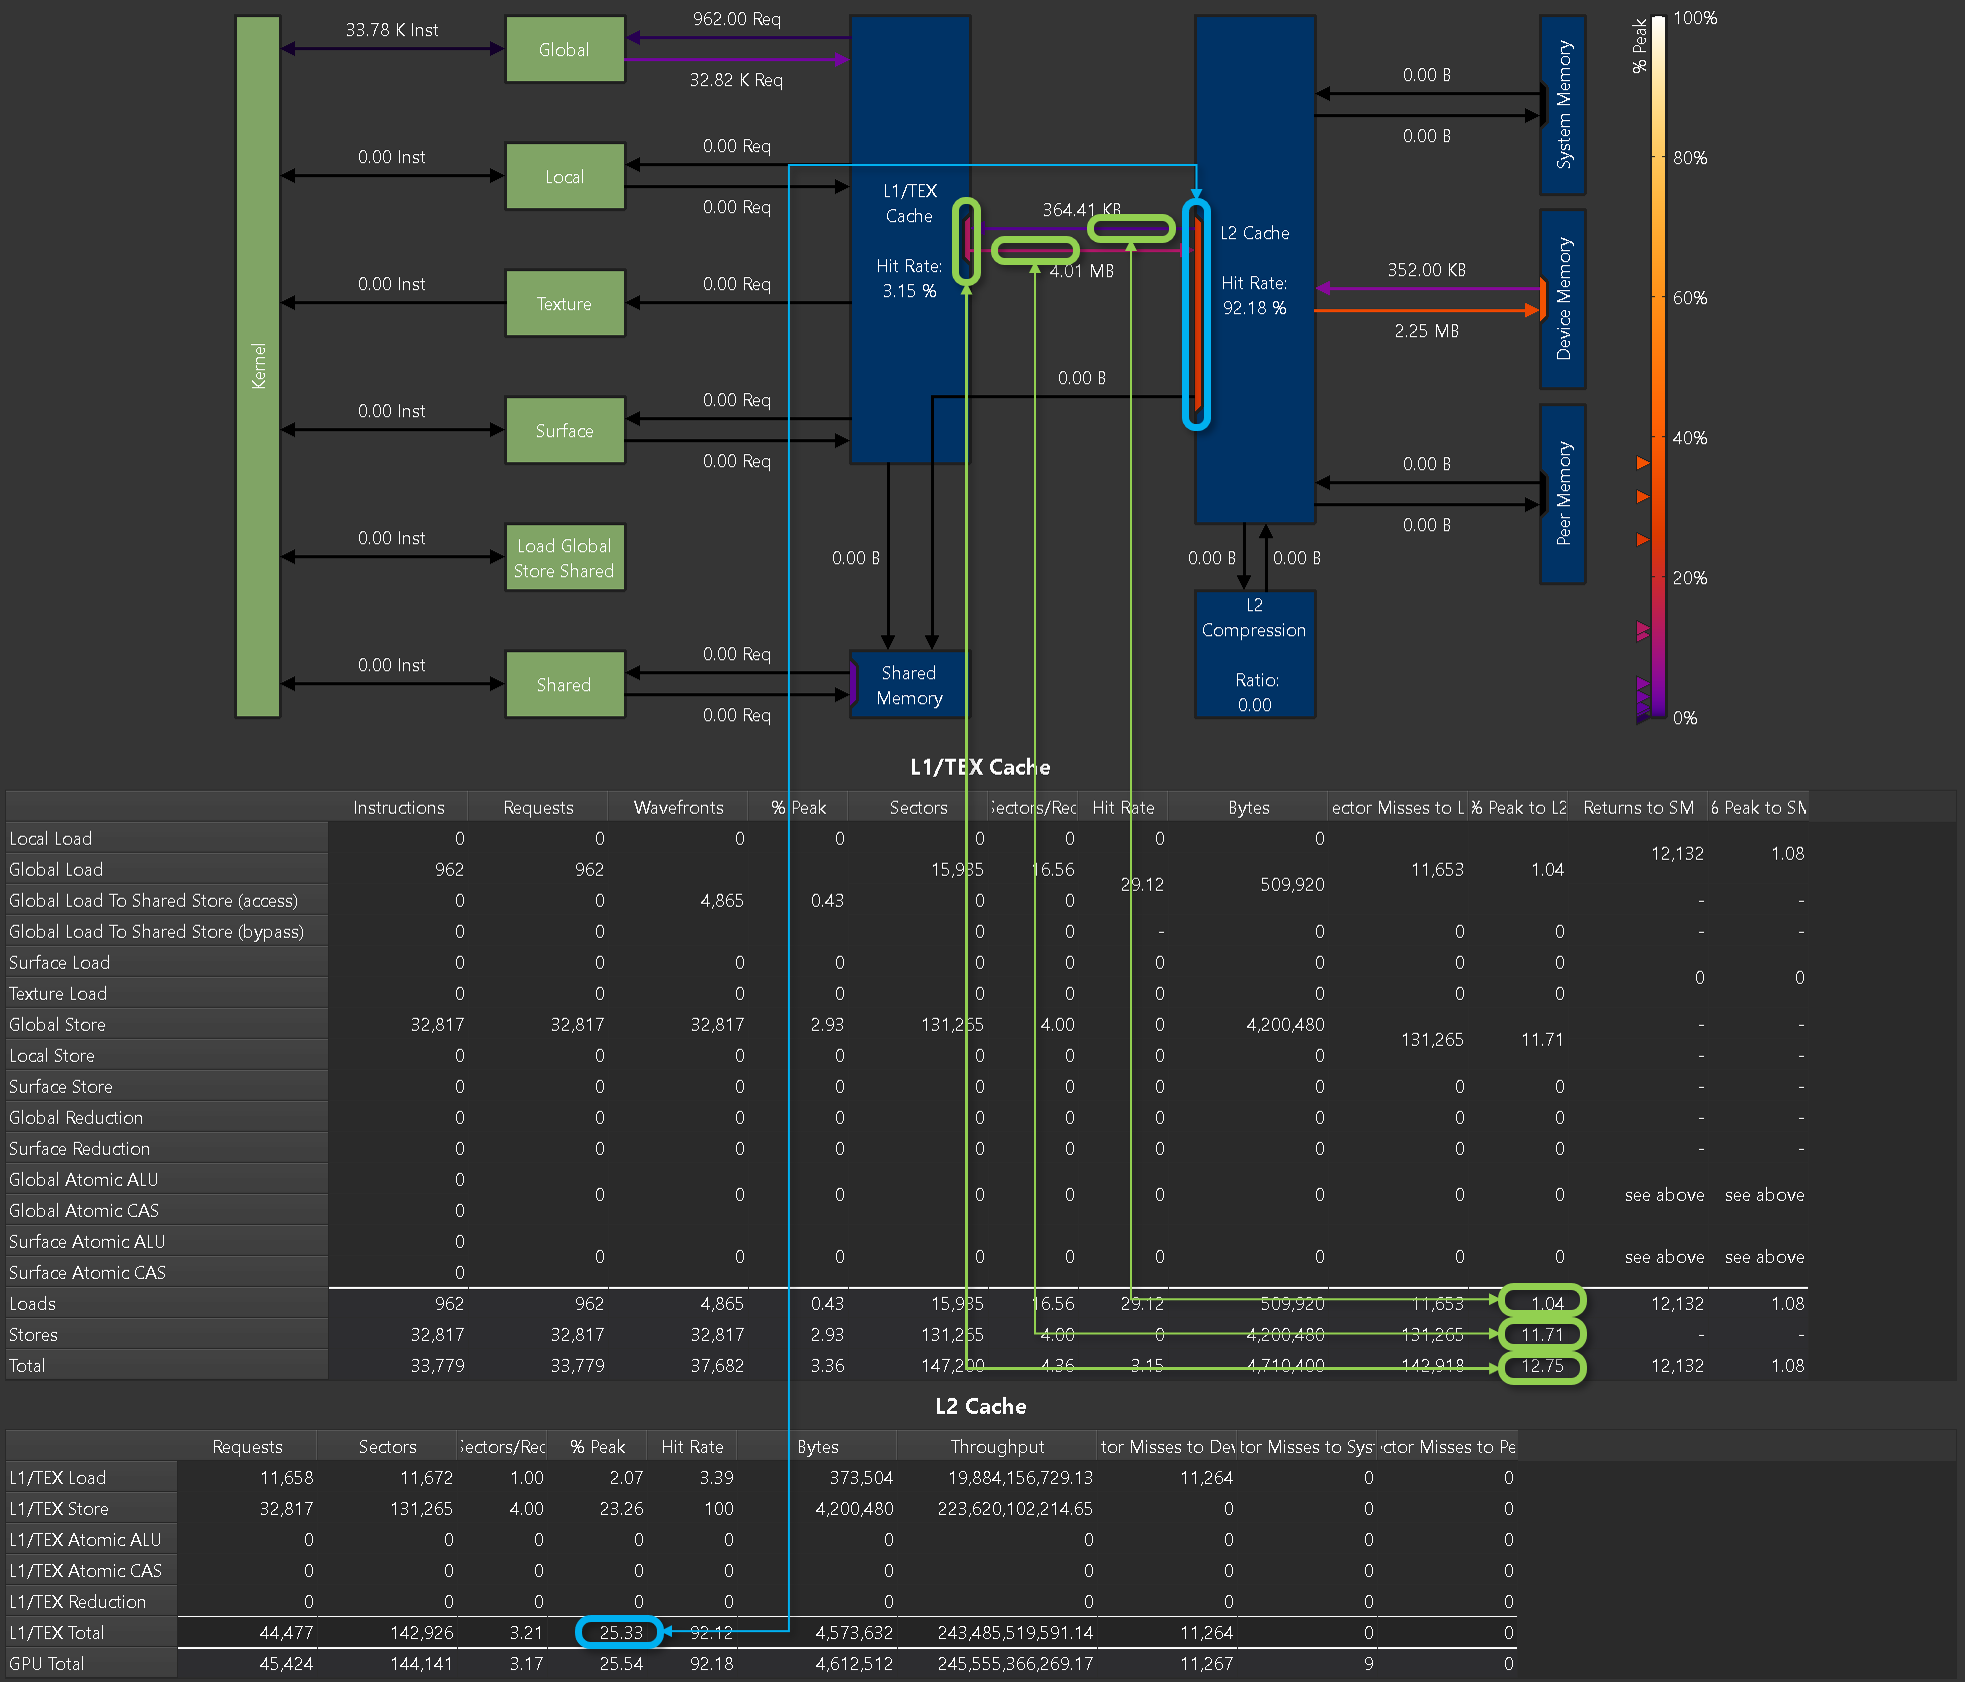
不同的访存行为 request 是相同的,但是使用的 sector 会根据访存行为有不同。对齐合并访问sector/request的应该是4,上图中为5,提从 DRAM 进行全局加载的内存访问模式可能并非最优。平均而言,每个扇区传输的 32 字节中,只有 25.6 字节被利用。这适用于 97.0% 的扇区。
在 Source Conter 部分,就可以定位到具体的性能提示定位源码。
Profiling Guide
Profiling Guide with metric types and meaning, data collection modes and FAQ for common problems.
Hardware Model
Compute Model
所有 NVIDIA GPU 均设计为支持通用异构并行编程模型,通常称为 _ 计算 _。该模型将 GPU 与传统图形管线分离,使其成为通用并行多处理器。异构计算模型意味着存在主机和设备,在这种情况下分别是 CPU 和 GPU。从宏观角度来看,主机(CPU)管理自身与设备之间的资源,并将工作分配给设备以并行执行。
Central to the compute model is the Grid, Block, Thread hierarchy, which defines how compute work is organized on the GPU. The hierarchy from top to bottom is as follows:
- A Grid is a 1D, 2D or 3D array of thread blocks.
- A Block is a 1D, 2D or 3D array of threads, also known as a Cooperative Thread Array (CTA).
- A Thread is a single thread which runs on one of the GPU’s SM units.
The purpose of the Grid, Block, Thread hierarchy is to expose a notion of locality amongst a group of threads, i.e. a Cooperative Thread Array (CTA). In CUDA, CTAs are referred to as Thread Blocks. The architecture can exploit this locality by providing fast shared memory and barriers between the threads within a single CTA. When a Grid is launched, the architecture guarantees that all threads within a CTA will run concurrently on the same SM. Information on the grids and blocks can be found in the Launch Statistics section.
The number of CTAs that fit on each SM depends on the physical resources required by the CTA. These resource limiters include the number of threads and registers, shared memory utilization, and hardware barriers. The number CTAs per SM is referred to as the CTA occupancy, and these physical resources limit this occupancy. Details on the kernel’s occupancy are collected by the Occupancy section.
Each CTA can be scheduled on any of the available SMs, where there is no guarantee in the order of execution. As such, CTAs must be entirely independent, which means it is not possible for one CTA to wait on the result of another CTA. As CTAs are independent, the host (CPU) can launch a large Grid that will not fit on the hardware all at once, however any GPU will still be able to run it and produce the correct results.
CTAs are further divided into groups of 32 threads called Warps. If the number of threads in a CTA is not dividable by 32, the last warp will contain the remaining number of threads.
The total number of CTAs that can run concurrently on a given GPU is referred to as Wave. Consequently, the size of a Wave scales with the number of available SMs of a GPU, but also with the occupancy of the kernel.
Grid、Block、Thread 层级设计旨在体现协作线程组(CTA,CUDA 中称为 Thread Block)内的局部性,架构可通过快速共享内存和 CTA 内线程屏障利用该局部性,且 Grid 启动时确保同一 CTA 内所有线程在同一 SM(流多处理器)上并发运行。 单 SM 可容纳的 CTA 数量(即 CTA 占用率)取决于 CTA 所需物理资源,包括线程数、寄存器、共享内存使用率及硬件屏障,相关内核占用率细节可查“Occupancy”部分。
The Streaming Multiprocessor (SM) is the core processing unit in the GPU. The SM is designed to simultaneously execute multiple CTAs. CTAs can be from different grid launches.
The SM implements an execution model called Single Instruction Multiple Threads (SIMT), which allows individual threads to have unique control flow while still executing as part of a warp. The Turing SM inherits the Volta SM’s independent thread scheduling model. The SM maintains execution state per thread, including a program counter (PC) and call stack. The independent thread scheduling allows the GPU to yield execution of any thread, either to make better use of execution resources or to allow a thread to wait for data produced by another thread possibly in the same warp. Collecting the Source Counters section allows you to inspect instruction execution and predication details on the Source Page, along with Sampling information.
Each SM is partitioned into four processing blocks, called SM sub partitions. The SM sub partitions are the primary processing elements on the SM. Each sub partition contains the following units:
- Warp Scheduler
- Register File
- Execution Units/Pipelines/Cores
- Integer Execution units
- Floating Point Execution units
- Memory Load/Store units
- Special Function unit
- Tensor Cores
Shared within an SM across the four SM partitions are:
- Unified L1 Data Cache / Shared Memory
- Texture units
- RT Cores, if available
A warp is allocated to a sub partition and resides on the sub partition from launch to completion.
A warp is referred to as active or resident when it is mapped to a sub partition. A sub partition manages a fixed size pool of warps. On Volta architectures, the size of the pool is 16 warps. On Turing architectures the size of the pool is 8 warps. Active warps can be in eligible state if the warp is ready to issue an instruction. This requires the warp to have a decoded instruction, all input dependencies resolved, and for the function unit to be available. Statistics on active, eligible and issuing warps can be collected with the Scheduler Statistics section.
A warp is stalled when the warp is waiting on
- an instruction fetch,
- a memory dependency (result of memory instruction),
- an execution dependency (result of previous instruction), or
- a synchronization barrier.
See Warp Scheduler States for the list of stall reasons that can be profiled and the Warp State Statistics section for a summary of warp states found in the kernel execution.
The most important resource under the compiler’s control is the number of registers used by a kernel. Each sub partition has a set of 32-bit registers, which are allocated by the HW in fixed-size chunks. The Launch Statistics section shows the kernel’s register usage.
Compute preemption avoids long running kernels from monopolizing the GPU, at the risk of context switch overhead. The execution context (registers, shared memory, etc.) is saved at preemption and restored later. Context switches happen at instruction-level granularity. The exclusive-process compute mode may be used on supported systems to avoid context switching.
Memory
- Global memory is a 49-bit virtual address space that is mapped to physical memory on the device, pinned system memory, or peer memory. Global memory is visible to all threads in the GPU. Global memory is accessed through the SM L1 and GPU L2.
- Local memory is private storage for an executing thread and is not visible outside of that thread. It is intended for thread-local data like thread stacks and register spills. Local memory addresses are translated to global virtual addresses by the AGU unit. Local memory has the same latency as global memory. One difference between global and local memory is that local memory is arranged such that consecutive 32-bit words are accessed by consecutive thread IDs. Accesses are therefore fully coalesced as long as all threads in a warp access the same relative address (e.g., same index in an array variable, same member in a structure variable, etc.).
- Shared memory is located on chip, so it has much higher bandwidth and much lower latency than either local or global memory. Shared memory can be shared across a compute CTA. Compute CTAs attempting to share data across threads via shared memory must use synchronization operations (such as
__syncthreads()) between stores and loads to ensure data written by any one thread is visible to other threads in the CTA. Similarly, threads that need to share data via global memory must use a more heavyweight global memory barrier. - Shared memory has 32 banks that are organized such that successive 32-bit words map to successive banks that can be accessed simultaneously.
Detailed memory metrics are collected by the Memory Workload Analysis section.
Caches
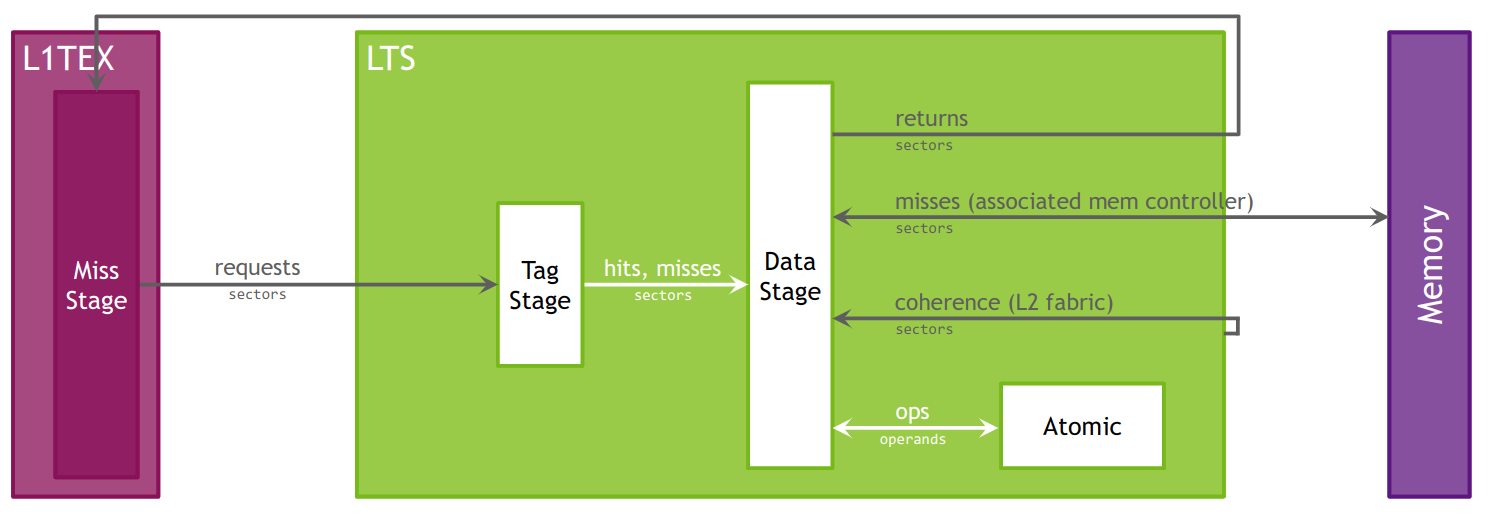
All GPU units communicate to main memory through the Level 2 cache, also known as the L2. The L2 cache sits between on-chip memory clients and the framebuffer. L2 works in physical-address space. In addition to providing caching functionality, L2 also includes hardware to perform compression and global atomics.
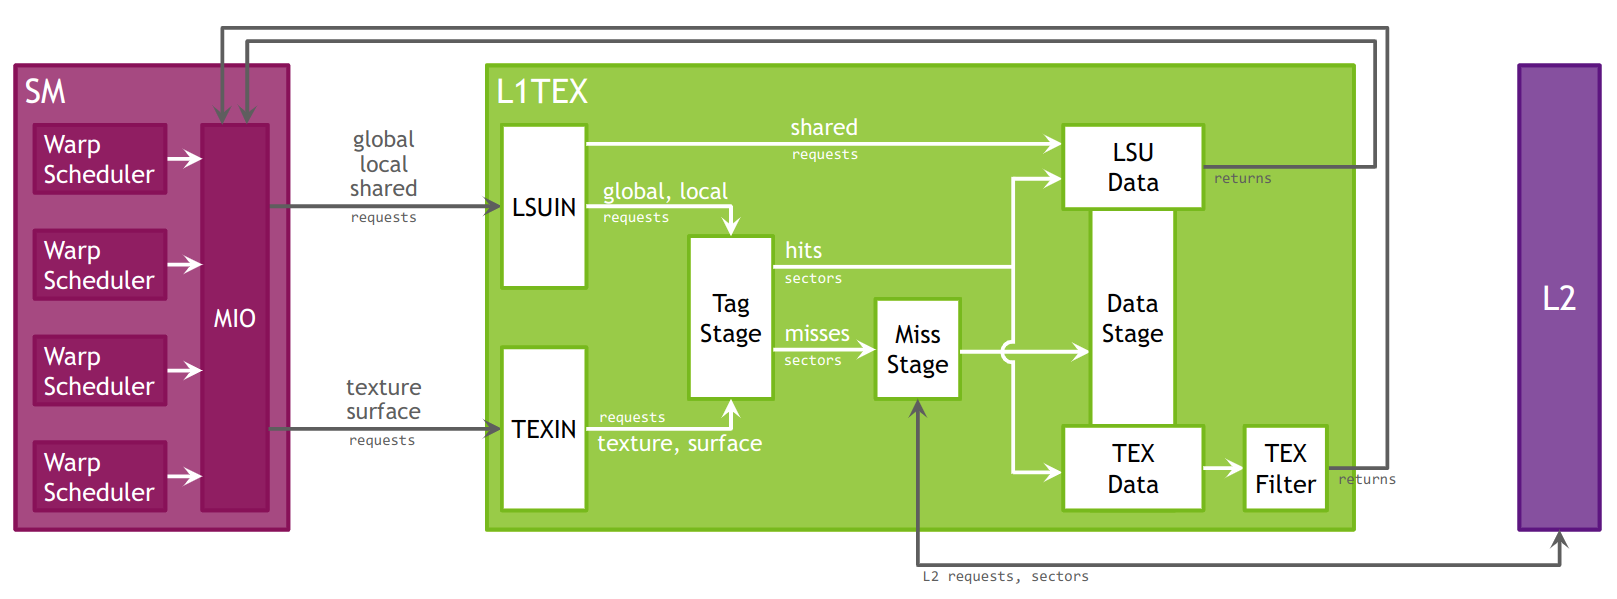
The Level 1 Data Cache, or L1, plays a key role in handling global, local, shared, texture, and surface memory reads and writes, as well as reduction and atomic operations. On Volta and Turing architectures there are , there are two L1 caches per TPC, one for each SM. For more information on how L1 fits into the texturing pipeline, see the TEX unit description. Also note that while this section often uses the name “L1”, it should be understood that the L1 data cache, shared data, and the Texture data cache are one and the same.
L1 receives requests from two units: the SM and TEX. L1 receives global and local memory requests from the SM and receives texture and surface requests from TEX. These operations access memory in the global memory space, which L1 sends through a secondary cache, the L2.
Cache hit and miss rates as well as data transfers are reported in the Memory Workload Analysis section.
Roofline Charts
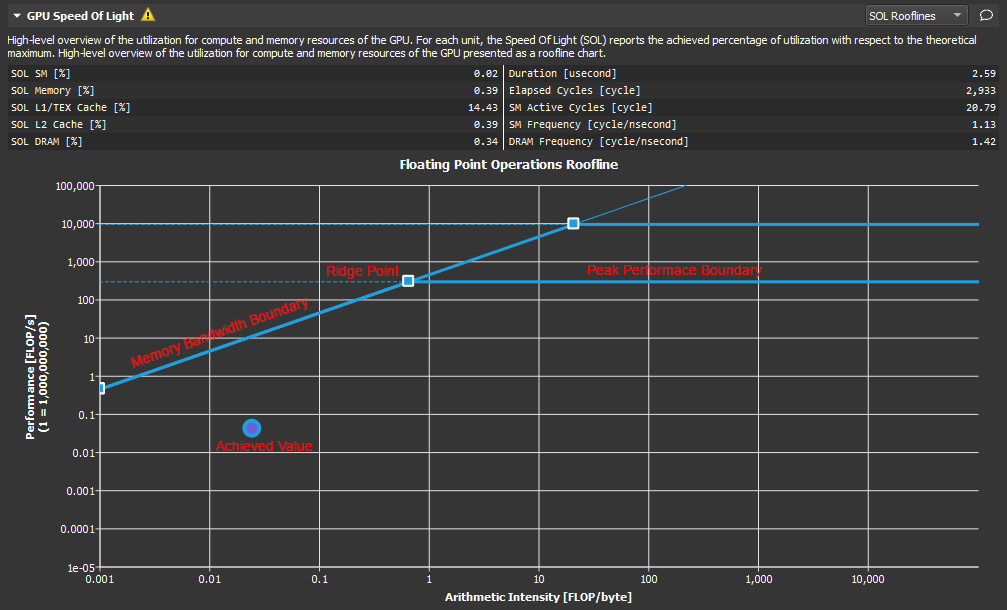
Kernel performance is not only dependent on the operational speed of the GPU. Since a kernel requires data to work on, performance is also dependent on the rate at which the GPU can feed data to the kernel. A typical roofline chart combines the peak performance and memory bandwidth of the GPU, with a metric called Arithmetic Intensity (a ratio between Work and Memory Traffic), into a single chart, to more realistically represent the achieved performance of the profiled kernel. A simple roofline chart might look like the following:
Roofline 图表把峰值算力和内存带宽这两个硬件上限与内核算术强度特性结合。
组成:
- Vertical Axis - The vertical axis represents Floating Point Operations per Second (FLOPS).
- Horizontal Axis - The horizontal axis represents Arithmetic Intensity, which is the ratio between Work (expressed in floating point operations per second), and Memory Traffic (expressed in bytes per second).
- Memory Bandwidth Boundary - The memory bandwidth boundary is the sloped part of the roofline. By default, this slope is determined entirely by the memory transfer rate of the GPU but can be customized inside the SpeedOfLight_RooflineChart.section file if desired.
- Peak Performance Boundary - The peak performance boundary is the flat part of the roofline By default, this value is determined entirely by the peak performance of the GPU but can be customized inside the SpeedOfLight_RooflineChart.section file if desired.
- Ridge Point - The ridge point is the point at which the memory bandwidth boundary meets the peak performance boundary. This point is a useful reference when analyzing kernel performance.
- Achieved Value - The achieved value represents the performance of the profiled kernel. If baselines are being used, the roofline chart will also contain an achieved value for each baseline. The outline color of the plotted achieved value point can be used to determine from which baseline the point came.
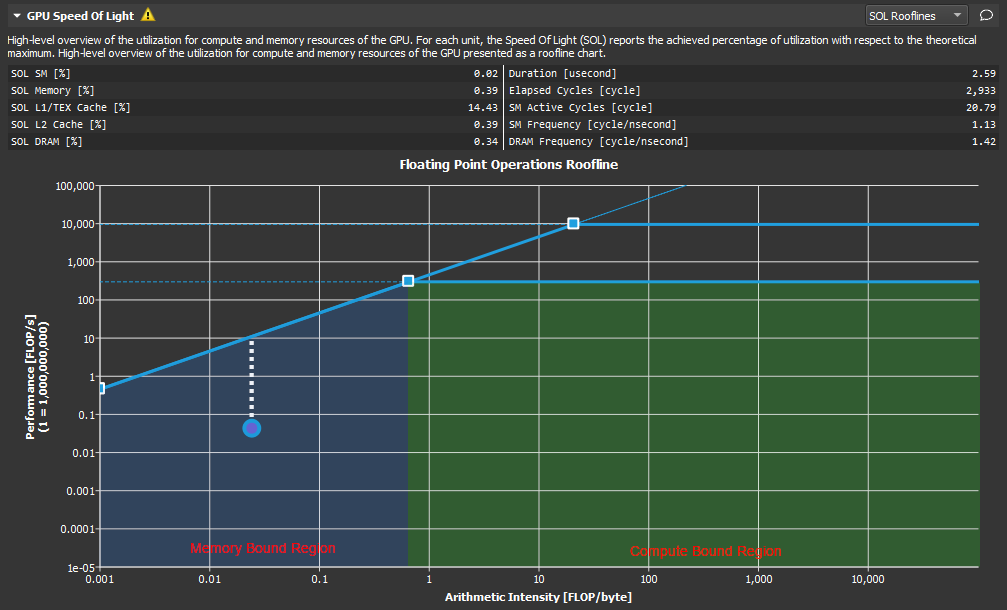
As shown here, the ridge point partitions the roofline chart into two regions. The area shaded in blue under the sloped Memory Bandwidth Boundary is the Memory Bound region, while the area shaded in green under the Peak Performance Boundary is the Compute Bound region. The region in which the achieved value falls, determines the current limiting factor of kernel performance.
The distance from the achieved value to the respective roofline boundary (shown in this figure as a dotted white line), represents the opportunity for performance improvement. The closer the achieved value is to the roofline boundary, the more optimal is its performance. An achieved value that lies on the Memory Bandwidth Boundary but is not yet at the height of the ridge point would indicate that any further improvements in overall FLOP/s are only possible if the Arithmetic Intensity is increased at the same time.
性能提升
算术强度反应计算和传输的比例,越高,说明越依赖运算。 内存带宽边界表明了内存带宽能支持的最大运算性能。性能是被数据传输带宽首先了,应该提高算术强度,让实际值向脊点右侧移动。 峰值性能边界表明了硬件本身达到的最大的运算性能。数据传输足够支持算术强度但是计算不足,应该优化运算逻辑,靠近性能边界。
Memory Chart
Overview
The Memory Chart shows a graphical, logical representation of performance data for memory subunits on and off the GPU. Performance data includes transfer sizes, hit rates, number of instructions or requests, etc.
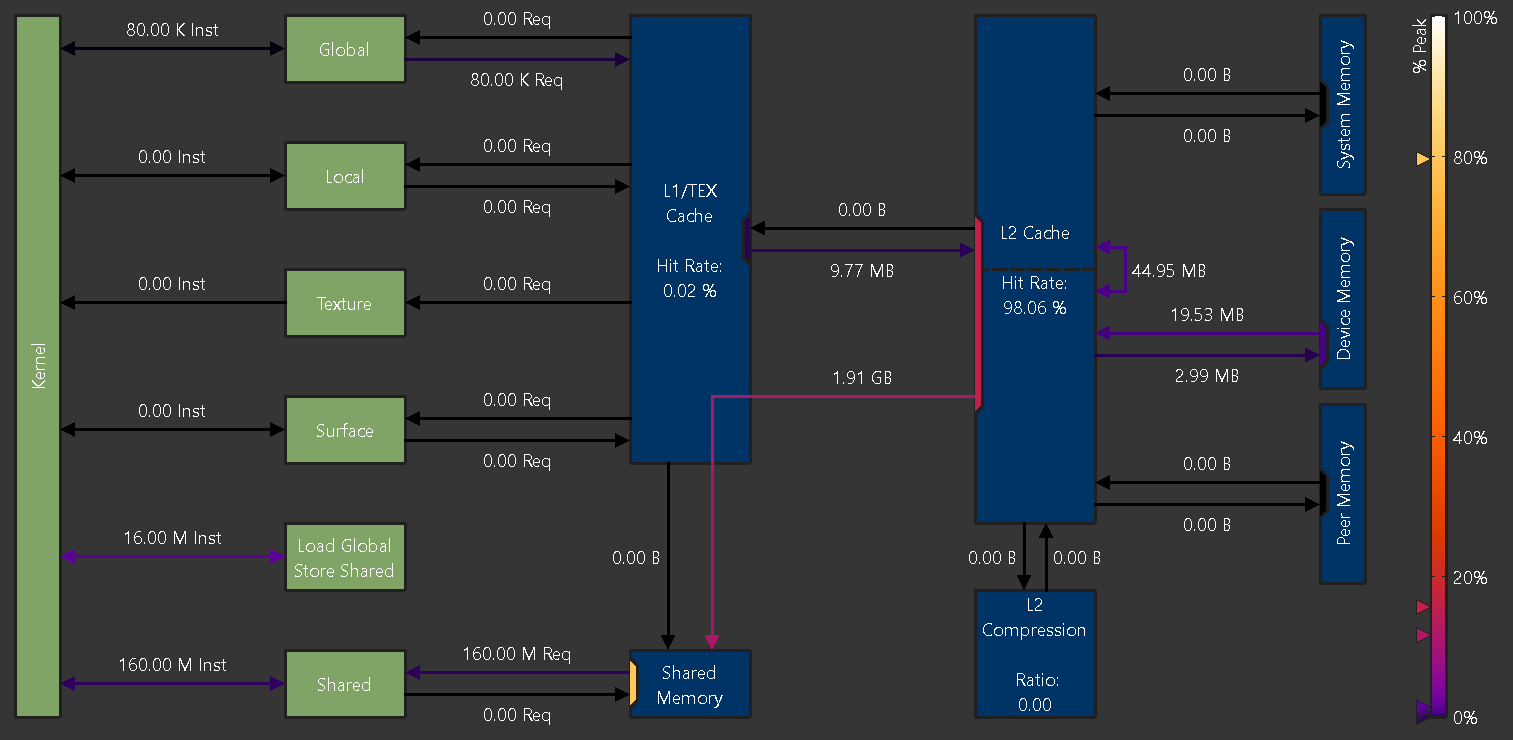
Logical units are shown in green (active) or grey (inactive).
- Kernel: The CUDA kernel executing on the GPU’s Streaming Multiprocessors
- Global: CUDA global memory
- Local: CUDA local memory
- Texture: CUDA texture memory
- Surface: CUDA surface memory
- Shared: CUDA shared memory
- Load Global Store Shared: Instructions loading directly from global into shared memory without intermediate register file access
Physical units are shown in blue (active) or grey (inactive).
- L1/TEX Cache: The L1/Texture cache. The underlying physical memory is split between this cache and the user-managed Shared Memory.
- Shared Memory: CUDA’s user-managed shared memory. The underlying physical memory is split between this and the L1/TEX Cache.
- L2 Cache: The L2 cache
- L2 Compression: The memory compression unit of the L2 Cache
- System Memory: Off-chip system (CPU) memory
- Device Memory: On-chip device (GPU) memory of the CUDA device that executes the kernel
- Peer Memory: On-chip device (GPU) memory of other CUDA devices
Depending on the exact GPU architecture, the exact set of shown units can vary, as not all GPUs have all units.
Links
Links between Kernel and other logical units represent the number of executed instructions (Inst) targeting the respective unit.
Instructions using the NVIDIA A100’s Load Global Store Shared paradigm are shown separately, as their register or cache access behavior can be different from regular global loads or shared stores.
Links between logical units and blue, physical units represent the number of requests ( Req) issued as a result of their respective instructions.
The color of each link represents the percentage of peak utilization of the corresponding communication path. The color legend to the right of the chart shows the applied color gradient from unused (0%) to operating at peak performance (100%). If a link is inactive, it is shown in grey color. Triangle markers to the left of the legend correspond to the links in the chart. The markers offer a more accurate value estimate for the achieved peak performances than the color gradient alone.
Ports
A unit often shares a common data port for incoming and outgoing traffic. While the links sharing a port might operate well below their individual peak performances, the unit’s data port may have already reached its peak. Port utilization is shown in the chart by colored rectangles inside the units located at the incoming and outgoing links. Ports use the same color gradient as the data links and have also a corresponding marker to the left of the legend. Inactive ports are shown in grey color.
Metrics
Metrics from this chart can be collected on the command line using --set full, --section MemoryWorkloadAnalysis_Chart or --metrics group:memory__chart. An example of the correlation between the peak values reported in the memory tables and the ports in the memory chart is shown below.
Gdb
经验
- 添加打印信息 log
- 边界保护
- 错误检查
添加调试编译
This line executes many non-fused floating-point instructions. To improve performance, consider converting pairs of non-fused instructions to FMA instructions and to enable NVCC's --use_fast_math or -- fmad=true compiler flags. This row is currently driving the correlation highlighting.
启用 --use_fast_math 编译标志:在编译 CUDA 代码时,给 NVCC 编译器添加 --use_fast_math 标志。这个标志会让编译器使用更快但精度可能稍低的数学运算实现,同时也会尽可能地融合浮点运算指令。
-O3的作用:启用编译器最高级别的优化(如循环展开、函数内联、代码重排等),最大化程序性能,但可能会改变代码的执行顺序(与源代码顺序不完全一致)。-g的作用:仅生成调试符号(包含源代码行号、变量名、函数名等信息),用于调试工具(如gdb、ncu)定位代码。-g可以开O3,-O3会导致变量被优化掉、代码执行顺序与源码不一致,可能无法在gdb中逐行调试或查看某些变量的值(但基本的断点和源码定位仍可用)。
-lineinfo:在 PTX 和 SASS 中嵌入源代码行号信息,建立 “汇编指令 ↔ 源码行号” 的映射关系。-lineinfo + -g结合使用: 能在 NCU 中显示 完整的源代码文本、PTX、SASS,以及三者的精确对应关系(推荐用于需要查看源码细节的场景)。-O0 -G打开,支持断点调试。
    # $<$<AND:$<COMPILE_LANGUAGE:CUDA>,$<CONFIG:Debug>>:-O2 -g -G> # -G是CUDA调试关键选项
    # Debug: -O2 -lineinfo 接近release行为
    $<$<AND:$<COMPILE_LANGUAGE:CUDA>,$<CONFIG:Debug>>:-O2 -g -lineinfo --use_fast_math>
注意 Debug 模式和 Release 模式在指令或行为上有很多不同。
调试方法
指令
获取当前所在位置信息:可以使用 cuda + device,sm,warp,lane,block,thread 等的形式获得
移动到指定的位置:可以使用 cuda+ device,sm 等 + 编号的形式实现
info threads //显示cpu的线程
thread 1 //跳转到thread1

info cuda threads //显示gpu线程信息
cuda thread 1 // GPU上线程跳转到1线程
如下的命令显示 GPU 的相关信息和 CUDA 应用的状态 (请使用 info cuda + 下面的关键字):
- devices 设备信息
- sms 设备的流处理器信息
- warps 在此 SM 上的 warp 信息
- lanes lanes 的信息
- kernels 当前核函数信息
- blocks 当前 blocks 信息
- threads 当前活动线程信息
- launch trace information about the parent kernels of the kernel in focus
- launch children information about the kernels launched by the kernels in focus
- contexts information about all the contexts
cuda 不支持 wtchpoints, 支持主机的 watchpoints
GPU Core Dump 支持
- 设置 CUDA_ENABLE_COREDUMP_ON_EXCEPTION 环境变量到 1 以便在遇到 GPU 异常时生成 GPU 核心转储。默认情况下禁用此选项
- 设置 CUDA_ENABLE_CPU_COREDUMP_ON_EXCEPTION 环境变量到 0 以便在遇到 GPU 异常时禁用生成 CPU 核心转储。当启用 GPU 核心转储生成时,此选项默认启用
- 设置 CUDA_ENABLE_LIGHTWEIGHT_COREDUMP 环境变量到 1 为了能够生成轻量级核心文件而不是完整的核心文件。启用后,GPU 核心转储将不包含应用程序的内存转储(本地、共享、全局)。默认情况下禁用此选项。
Hang
当 CUDA 程序卡住且 GPU 占用率 100% 时,通常是由于死锁、无限循环、内存访问越界或资源竞争导致的。以下是系统的排查方法:
一、快速定位问题类型
-
检查是否死锁 死锁常发生在使用
__syncthreads()时,不同线程块或线程束(warp)未同步执行。例如:if (threadIdx.x == 0) { // 某些操作 } __syncthreads(); // 危险:若部分线程未执行到此处,会导致死锁特征:程序完全卡住,GPU 占用率 100% 且无法中断(需强制终止)。
-
检查是否无限循环 循环条件错误(如索引未正确递增)可能导致线程无限执行。例如:
while (i < N) { // 缺少 i++,导致无限循环 }特征:GPU 持续高负载,程序长时间无输出。
-
检查内存越界 访问超出分配范围的全局/共享内存,可能导致硬件级别的错误,表现为程序卡住或崩溃。
二、工具排查步骤
1. 用 nvidia-smi 确认进程状态
首先确认是哪个进程占用 GPU:
nvidia-smi # 查看 GPU 进程,找到占用率 100% 的 PID- 若进程状态为
R(运行中)但无进展,可能是死锁或无限循环。 - 若状态为
E(错误),可能是内存越界或硬件错误。
强制终止异常进程:
sudo kill -9 <PID> # 替换为 nvidia-smi 中查到的进程 ID2. 用 cuda-gdb 调试死锁/无限循环
编译时添加调试标志:
nvcc -g -G your_program.cu -o your_program # -G 启用设备调试启动调试并设置断点:
cuda-gdb ./your_program
(cuda-gdb) break your_kernel  # 在 kernel 入口设断点
(cuda-gdb) run  # 运行程序
当程序卡住时,中断调试并检查线程状态:
# 中断调试(在另一个终端执行)
kill -SIGINT <cuda-gdb 进程 PID>

# 在 cuda-gdb 中查看线程状态
(cuda-gdb) info cuda threads  # 查看所有线程是否卡在同步点
(cuda-gdb) cuda thread (x,y,z) in block (x,y,z)  # 切换到不同线程
(cuda-gdb) where # 查看当前线程的调用栈,确认是否在循环或同步点关键检查:
- 线程是否都停在
__syncthreads()处(死锁特征)。 - 线程是否卡在循环中(通过
print循环变量确认)。
3. 用 compute-sanitizer 检测内存错误
NVIDIA 官方工具 compute-sanitizer(前身为 cuda-memcheck)可检测内存越界、未初始化内存访问等问题:
compute-sanitizer --tool memcheck ./your_program- 若输出
out of bounds memory access,说明存在内存越界。 - 若输出
use of uninitialized memory,需检查变量初始化。
优势:无需修改代码,直接运行即可定位内存相关的隐性错误(这类错误常导致程序卡住而非崩溃)。